
We wrote in a previous blog that one of the most common questions asked us is “how busy is this road?” It’s a question asked by clients with drive-thru format stores, petrol station forecasts, dark stores and restaurants wanting to break into the booming delivery market, to name but a few.
When we were approached by a South Korean client who wanted to incorporate traffic and road utilisation in the modelling of their network blueprint to help identify potential drive-thru sites, we realised we might need to build a new dataset for the job. It was one of the most ambitious data networks we have created; a modelled value for traffic count for every major road in the country of operation - an international version of our UK Road and Traffic dataset.
For the baseline road network we decided to work with what was already openly available – pulling data available for South Korea from Open Street Map. Using an open source converter, we then processed the data to extract the Roads as a reputable network.
In order to validate our modelled traffic values (essentially confirm our data was correct), we then needed some actual traffic counts. Luke, in our Tokyo office, discovered this exact data set from Topis. With all of this, we were ready to start modelling!
To ensure we could accurately confirm traffic flow between our known survey points, we:
- Used the routability of the road network
- Exploited the power of graph theory calculations
What is graph theory, you might ask?
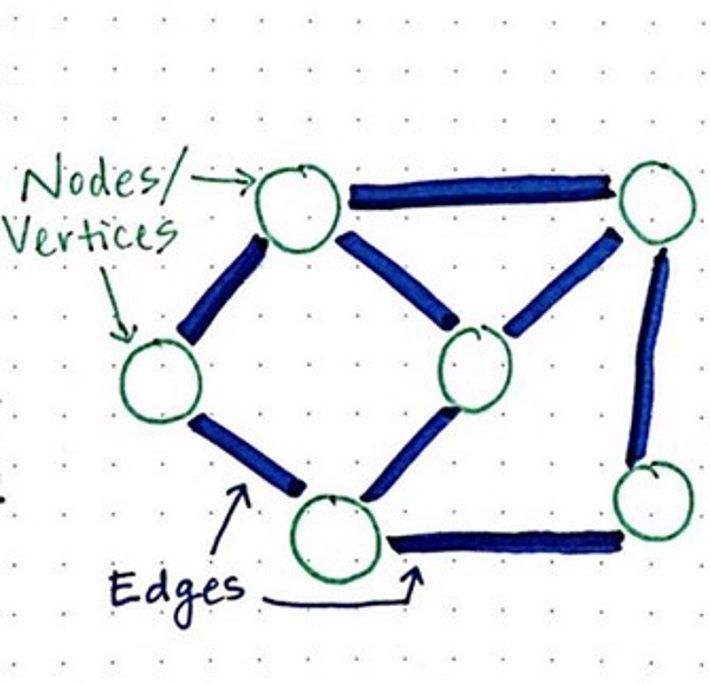
Graph theory is the study of a network of related objects where the vertices (or, points) are related (connected) to each other by edges (or, lines).
Graphs are used in a diverse number of fields, such as helping explain social networks (its in the name). We briefly need to explain the two different types of graphs: Directional and Non-Directional.
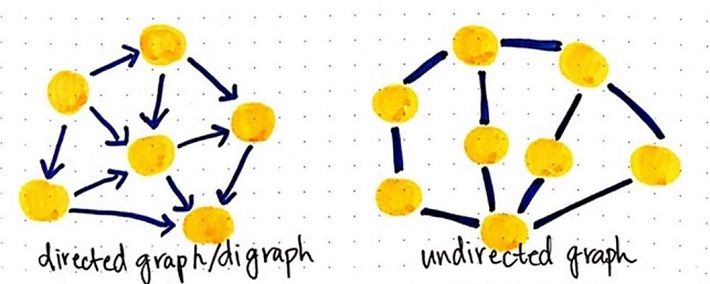
Essentially, undirected graphs can travel in any way between the nodes, whereas directed graphs have a set direction that they have to follow.
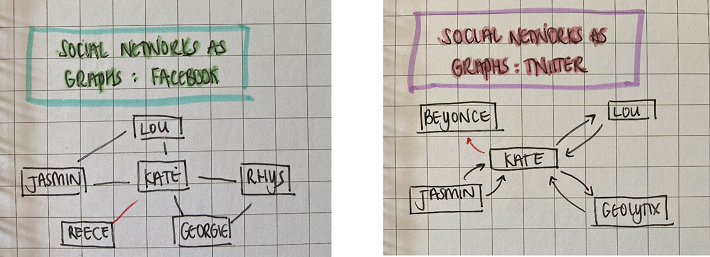
How does this link to social networking?
Facebook is an undirected graph network; if I add you, you must add me back in order to be friends (friendship is a two-way street) and so the edges between the vertices must be unidirectional (as in, you have to be able to travel both ways).
Twitter however is a directed graph network; I can follow Beyoncé but she wouldn’t have to follow me back (sadly). The caveat here is, that if Beyoncé were to follow me back, not only would I be over-joyed, but it wouldn’t become undirected. I would simply get a second edge going between the vertices, as Beyoncé could unfollow me at any point.
I digress – but hopefully you now have a somewhat understanding of the graph theory.
Back to roads!
Roads are essentially a network of connected junctions (think back to the vertices and edges):
- If we know the distance (in real space) between these junctions, we can give the edges a weight
- If we know if the road is one way or not, we can give the edges a direction
So we now have a weighted, directed network which we can do some pretty cool things with!
Graph algorithms are uses in a multitude of ways, such as:
- Community detection (how do the vertices group together, e.g, do they cluster?)
- Finding the shortest path
- Measuring connectedness
This final point, measuring connectedness, was essentially our golden ticket to inferring the traffic counts on the network. It helps us determine just how busy a road is likely to be.
We used the algorithm called betweenness centrality; it essentially measures the importance of each vertices in the flow through the network, giving a score of influence by assessing how many times a vertices is used in the shortest path between two other nodes.
We can visualise this easily when looking at how betweenness centrality is used in social sciences; take your team for example – who is the most important person in the team when it comes to the flow of information?
For us, it gives us a measure of how utilised a road is based on the extensive number of different paths that can be made through the network – if a road is likely to be used on the most journeys, we would think it is likely to have the most cars on it.
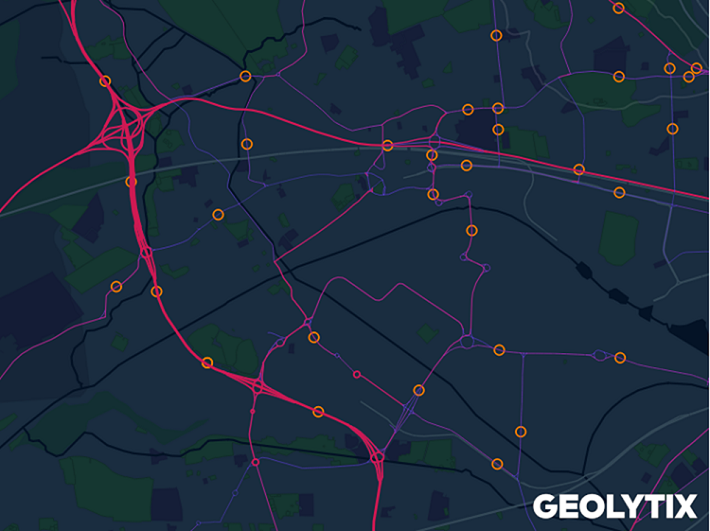
Lets bring it back to South Korea.
We had 1,180,756 roads in South Korea to work with, and because of this scale of network, we needed some horse power (and a lot of coffee!)
We used a Google Cloud Dataproc machine, to get Hadoop, an open source data processing wonder-machine to do some of the heavy lifting. We got to work writing a script that would calculate the betweenness of the edges based on the shortest paths – remember, we are trying to pinpoint the likely busiest roads.
Technical jargon coming up…
We calculated the betweenness of the edges based on shortest paths within a certain depth of the vertices (we created a radius around each vertices). In theory, betweenness is based on calculations, however, in reality it is just too much calculation and after a certain threshold you gain no more insight through calculating more and more routes.
Once we assigned the surveyed traffic counts to their nearest roads, and applied any relative urbanities to the network, we used a delta difference approach to then smooth these traffic counts across the network. With some final tweaking we were happy with the outputs and incorporated this into our clients network blueprint.
This then helped then identify opportunities for new drive-thrus.
At Geolytix we aren’t afraid of a challenge, we like to push the boundaries of the data we work with and are constantly creating new datasets or improved the ones we have created over the years.
A prime example would be the Modelled Traffic Volumes in our Road & Network data pack.
Our Road & Network data pack is a staple Geolytic product used frequently both in-house and by clients. Based on OS data (including the Meridian 2 product and the Open Roads) we keep these topologically correct street geometries up to date.
We also, consolidate, clean and maintain the Department for Transports traffic volume survey data, which is comprised of almost 30 thousand observation points across the UK. Whilst it is representative and well-regarded quality-wise, it can be rather challenging to disaggregate it properly at road level.
And then we remembered the work we did in South Korea and our brains started ticking. We could apply the same principal of betweenness centrality, making a graph model of all non-local roads in the UK. To remind, we would measure a vertices connectedness between other vertices based on shortest paths, indicating the important (busy) edges in the network.
This was our starting point for disaggregating our real world traffic observations in a smarter way. This Modelled Traffic Volume dataset is fully functional in MAPP. As MAPP is an online mapping tool, you can visualise all UK roads, zoning in on individual sections to see our modelled average daily traffic volume, allowing comparison between sites without leaving your web browser.
Chris Storey & Kate McGoldrick, Data Scientist and Communications Officer at Geolytix
Photo by Markus Winkler on Unsplash


